

EdU T Cell Proliferation Assay for Flow Cytometry
Accurate, Direct and Multiparametric Analysis of Human T-cell Proliferation
| Size | Catalog No. | Price |
|---|---|---|
| Dye 488 / 48 Assays | BCK-TCell-FC488_48 | € 170,00 |
| Dye 488 / 192 Assays | BCK-TCell-FC488_192 | € 400,00 |
| Dye 647 / 48 Assays | BCK-TCell-FC647_48 | € 170,00 |
| Dye 647 / 192 Assays | BCK-TCell-FC647_192 | € 400,00 |
Chemical Properties
-
Shelf Life
12 months unopened after receipt
-
Storage Conditions
2-8 °C
-
Physical State
kit system made of different components
-
CAS Number
n.a.
-
Excitation (max)
Dye 488: 496 nm | Dye 647: 643 nm
-
Emission (max)
Dye 488: 516 nm | Dye 647: 662 nm
-
Ɛ (max)
Dye 488: 83.000 cm-1M-1 | Dye 647: 250.000 cm-1M-1
-
Preparation/Handling
please see user manual of the kit
Product Information
S‑Phase specific detection of activated T cells for functional immune analysis
EdU-based assays quantify DNA synthesis in actively dividing cells and provide a direct, time resolved readout of proliferation at the single-cell level. During S-phase, EdU is incorporated into newly synthesized DNA and detected via click chemistry, enabling highly specific labeling of proliferating cells.
The assay identifies cells that are actively progressing through S-phase within a defined labeling window. By controlling the timing of EdU exposure, proliferation can be analyzed under clearly defined experimental conditions.
You obtain insight into:
- actively dividing cell populations
- timing and dynamics of cell cycle progression
- proliferation responses to stimulation or inhibition
This allows a more precise interpretation of biological activity compared to indirect proliferation markers.
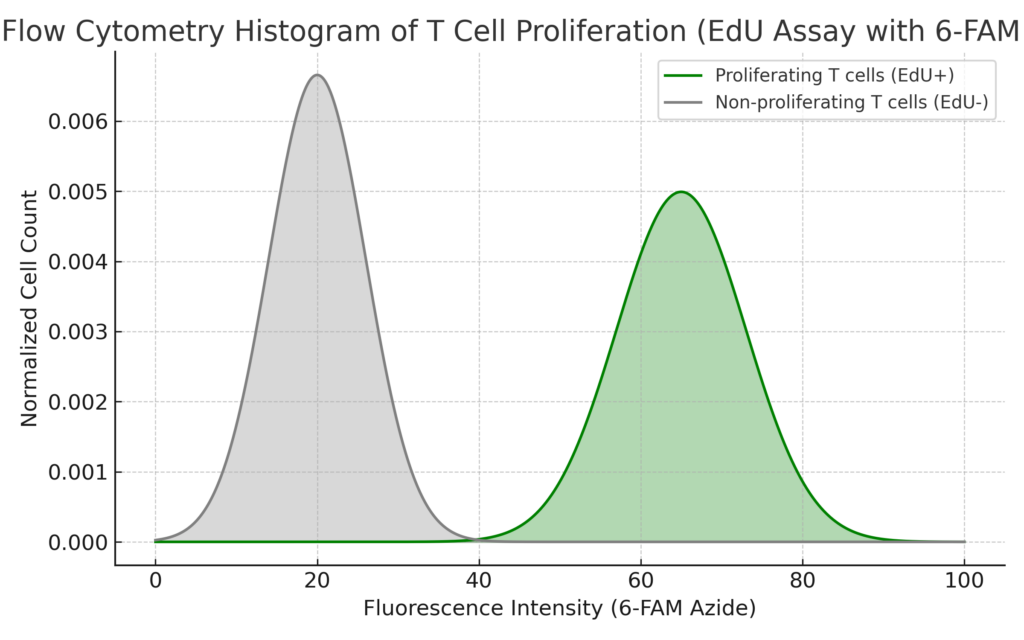
Figure 1: Flow cytometry histogram showing T cell proliferation detected via EdU incorporation and 6-FAM azide staining. The histogram displays two distinct populations:
Proliferating T cells (EdU⁺) are represented by the larger peak at higher fluorescence intensity (colored in light green), indicating successful incorporation of EdU during DNA synthesis.
Non-proliferating T cells (EdU⁻) form a separate peak at lower fluorescence intensity (gray), reflecting cells that did not enter S-phase during the EdU pulse.
Experimental flexibility
A key strength of the EdU assay is the ability to control proliferation during the experiment. Cell division can be induced, monitored, or intentionally suppressed depending on the biological question.
For example, proliferation can be modulated by:
- cell cycle regulation mechanisms (e.g. Rb pathway)
- mitotic inhibitors such as tubulin-targeting agents
These blockers can effectively stop mitosis, preventing cells from completing cell division while still allowing analysis of DNA synthesis or cell cycle progression.
This enables controlled experimental setups in which proliferation is not only measured, but actively manipulated, allowing clearer interpretation of treatment effects or cellular responses.
Application focus: functional T‑cell response analysis
EdU assays are widely used in immunology to analyze T-cell activation and expansion, including antigen-specific responses. In immuno-oncology, they support functional profiling of immune cells under therapeutic conditions.
Typical use cases include:
- T-cell proliferation and immune activation
- immuno-oncology and cell therapy (e.g. CAR‑T)
- drug screening and mechanism-of-action studies
- cell cycle analysis and S-phase quantification
Integration into flow cytometry workflows
EdU can be directly integrated into multicolor flow cytometry panels. Since the detection method preserves epitopes, it is fully compatible with both surface and intracellular staining.
This allows proliferation to be analyzed together with phenotype and function within the same sample.
Example panel:
- CD3 / CD8 → T-cell identity and subtype
- IFNγ → functional activation
- EdU → proliferation (S-phase)
This combined readout enables the identification of activated T cells that are also actively proliferating, adding a critical functional dimension to standard panel-based analysis.
Advantages and Key features
EdU-based assays provide a direct and biologically relevant readout of DNA synthesis. In contrast to indirect approaches, they measure true S-phase activity and therefore reflect real proliferation events.
Key advantages include:
- Direct detection of S‑phase cells via EdU incorporation
- No DNA denaturation required, preserving epitopes for downstream analysis
- Compatible with multicolor flow cytometry panels
- Suitable for complex co-culture and PBMC systems
- Rapid click chemistry–based detection (~30 minutes post-labeling)
- high sensitivity with low background signal
- compatibility with flow cytometry, imaging, and HTS formats
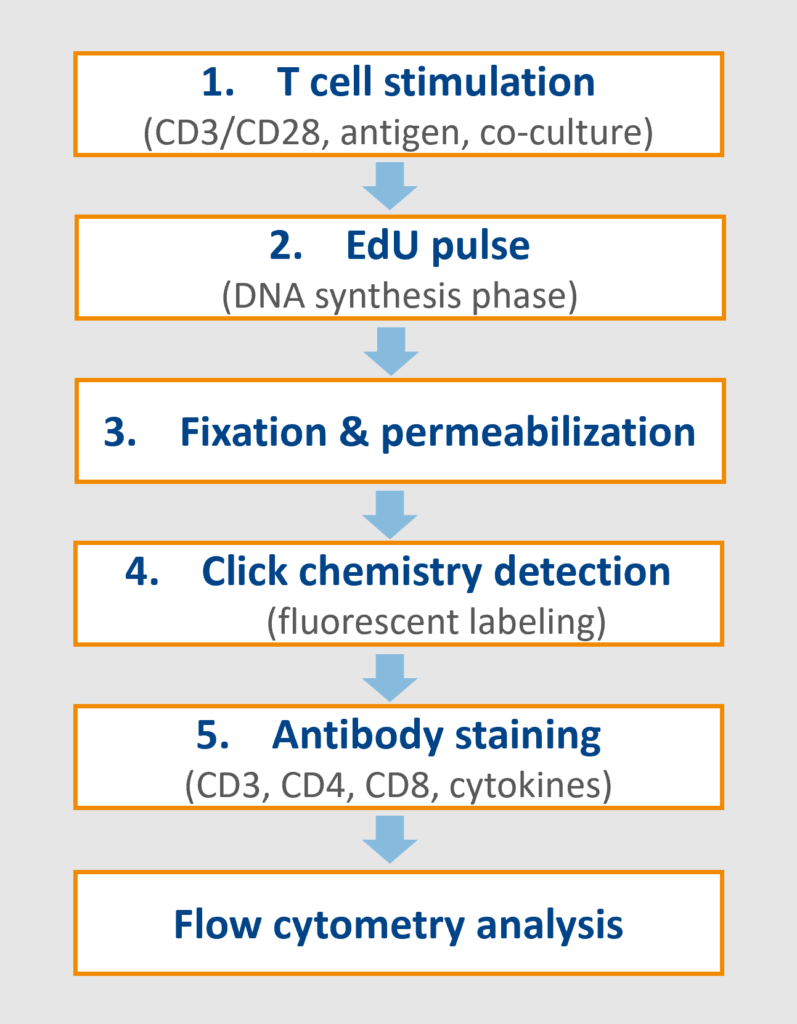
Workflow
The assay can be integrated easily into standard immunophenotyping workflows in five easy steps:
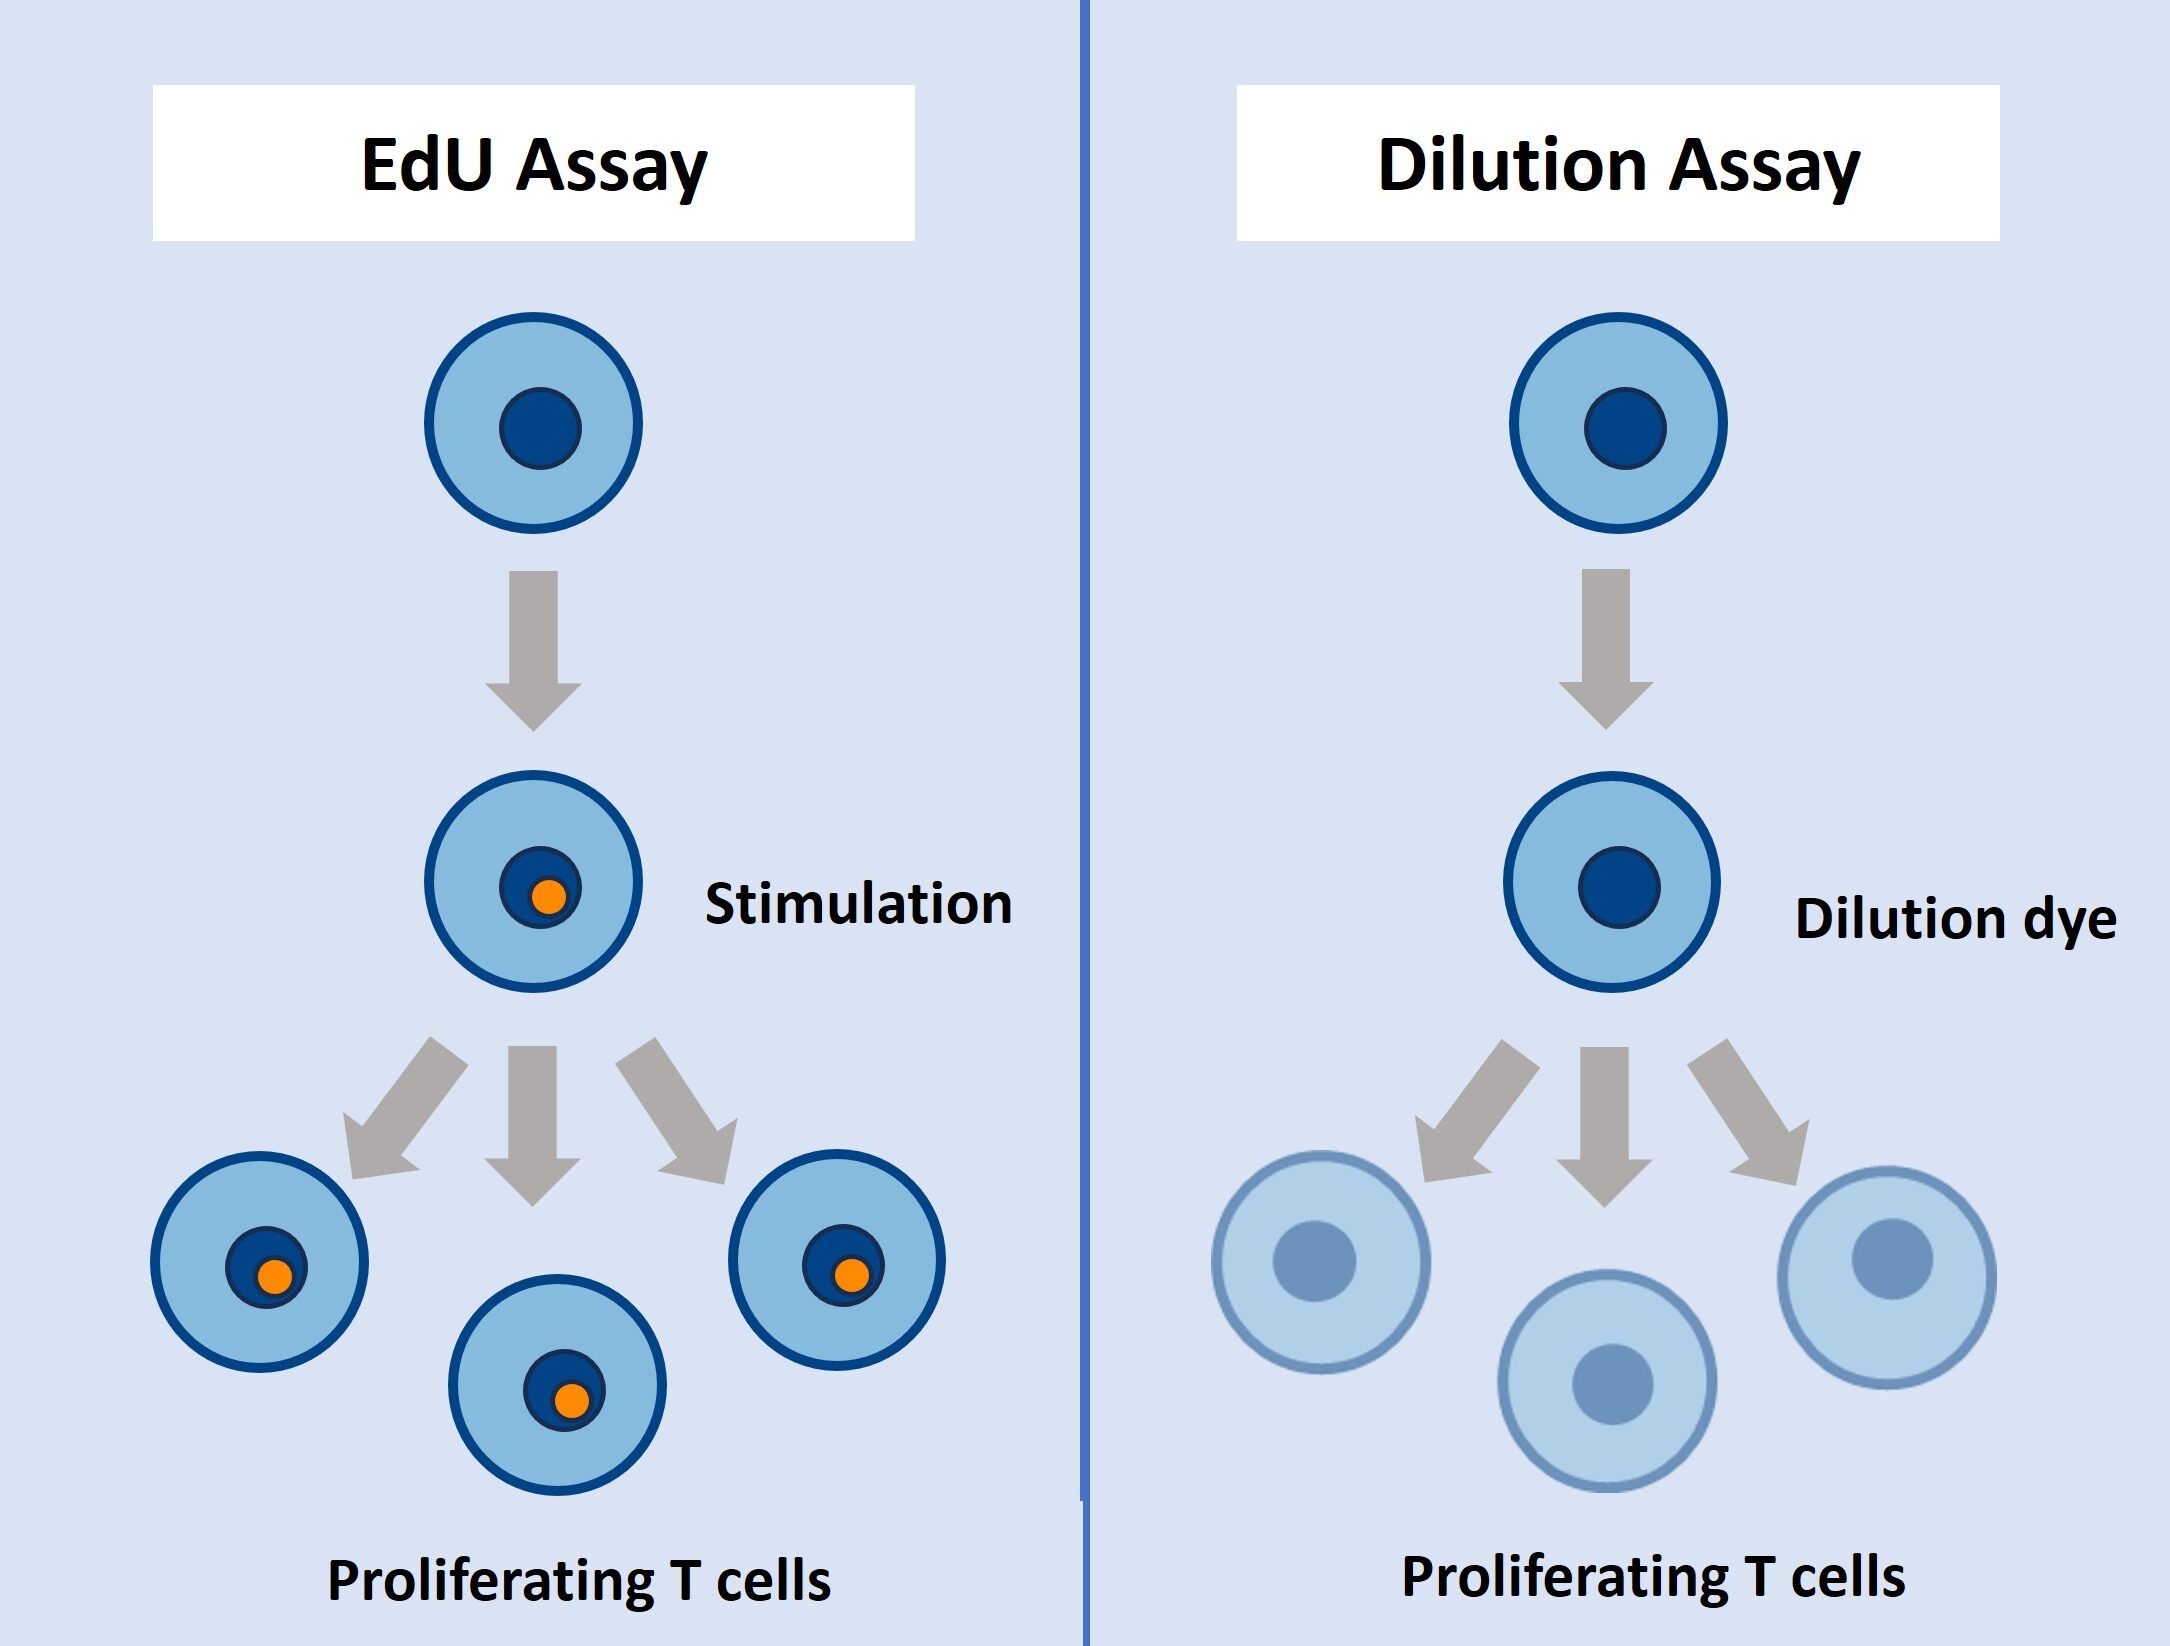
Position within proliferation assays
In contrast, dye dilution methods measure cell division history over multiple generations and typically require longer incubation periods. EdU enables faster and more defined analysis of early proliferation events.
This makes EdU particularly suitable for:
- short-term stimulation assays
- early activation studies
- functional immune profiling
Advantages for immunology studies
Flow cytometry-based proliferation assays enable:
- analysis of proliferation at the single-cell level
- simultaneous characterization of multiple functional parameters
- identification of proliferative responses in specific T-cell subsets
Literature
A sensitive and less cytotoxic assay for identification of proliferating T cells based on bioorthogonally-functionalized uridine analogue, F. C. Stempels et al., 2022, Journal of Immunological Methods, Vol. 502, p. 113228.
https://doi.org/10.1016/j.jim.2022.113228
FAQ
-
How does EdU labeling compare to methods based on label dilution?
Mostly, dilution-based T cell proliferation probes conjugate unspecifically to amine groups in cells. Each cell division then results in dilution (takes several days) of the probes. Main disadvantages are cytotoxicity, an impact on T cell activation and long incubation time (several days and up to a week) before readout. The superior EdU cell proliferation assay relies on the incorporation of the modified uridine analog EdU in the DNA of proliferating T cells (just 2 hours before harvesting) and subsequent detection. Both methods enable detection and quantification of T cell proliferation by flow cytometry. Our EdU incorporation assay is very sensitive, and can be multiplexed with other fluorescent stainings.
- EdU outperforms a standard dilution-based probe in detecting T cell proliferation
- The EdU assay is less cytotoxic for human T cells
- The EdU assay offers superior signal-to-background ratio
- The EdU assay allows for better discernable interferon gamma responses
-
Can I combine the EdU T cell Proliferation assay and staining with PerCP, APC, APC-based tandems, RPE, PR-tandem, Quantum Dot antibody conjugates or intracellular antigens?
Yes, this is feasible. Please note that staining with PerCP, APC and APC-based tandems may be performed before the EdU detection step (click reaction), while RPE, PR-tandem or Quantum Dot antibody conjugates and detection of intracellular antigens should be performed after the click reaction. Check also the user manual for further information. Please, make sure that the emission spectra of the fluorochromes to be combined do not overlap extensively, so that their signals can be distinguished unequivocally using appropriate emission filters or spectral demixing.
-
When may break points be introduced during the protocol?
It is possible to safely interrupt the protocol after the fixation step. Thereto, remove the fixation solution and wash as suggested by the user manual, then the cells can be stored in buffer at 4° C. Alternatively, the experiment can also be safely interrupted after permeabilization, again as described above.
Please note: It is important to proceed with the experiment if the click cocktail for the detection of the EdU has been prepared already. -
How to determine the EdU incubation time?
The EdU incubation time depends on the cell type or organism, the applied EdU concentration and the experimental design. For a start it is advisable to refer to a literature protocol (which is close to your experimental setup) and to test the conditions with a low number of samples. As a general guideline we recommend to use a maximum of 10 µM final EdU in the cell culture medium for incubations. For longer incubation (> 1 day) the concentration should be decreased to 1-5 µM.